Housing Market Updates

2020 Forecast Shows Continued Home Price Appreciation

Questions continue to rise around where home prices will head in 2020. The latest forecast from CoreLogic shows continued appreciation at 5.4% over the next year:

Kate_Spad_Blog_Forecasted_Year_Over_Year_Change_In_Price.jpg

Additionally, ARCH Mortgage Insurance Company in their current Housing and Mortgage Market Review revealed their latest ARCH Risk Index, which estimates the probability of home prices being lower in two years. Based on the most recent results, 32 of the 50 U.S. states (plus D.C.) had a minimal probability of lowering by 2021.

Kate_Spadarotto_Probability_Home_Prices_Being_Lower.jpg

Bottom Line

Experts forecast home price appreciation to continue at a moderate rate as we move through 2020 and beyond. With appreciation growing, now is a great time to reach out to a real estate professional and plan for your next move.

Holiday Gifts Are Not the Only Hot Things Right Now

Black Friday is behind us and holiday gifts are flying off the shelves in stores and online. Unlike last year, however, there’s another type of buyer that is very active this winter – the homebuyer.

Each month, ShowingTime releases their Showing Index, which tracks the average number of appointments received on active U.S. house listings. The latest index revealed:

“Traffic was more active once again compared to 2018, as the nation saw its third straight month of higher year-over-year showing activity…The 5.5% increase in showings nationwide was the largest jump in activity during the now three-month streak of year-over-year increases vs. 2018.”

The same report indicates showings increased in every region of the country:

  • The South increased by 10.8%

  • The West increased by 8.6%

  • The Northeast increased by 3.8%

  • The Midwest increased by 1.5%

Why is the traffic more active?

One of the main reasons buyer traffic has increased year-over-year is that mortgage rates have fallen dramatically. According to Freddie Mac, the average mortgage rate last December was 4.64%. Today, the rate is almost a full percentage point lower!

Bottom Line

There are first-time, move-up, and move-down buyers actively looking for the home of their dreams this winter. If you’re thinking of selling your house in 2020, you don’t need to wait until the spring to do it. Your potential buyer may be searching for a home in your neighborhood right now.

December 2019: The Buyer Stakes Are High Because Inventory Is Low

The reality of what we’re seeing this month is that homes are selling fast. In today’s strong seller’s market, bidding wars are common and expected with starter or entry-level homes.

In most areas of the country, first-time buyers have been met with fierce competition throughout their home buying experience. Some have been out-bid multiple times before finally going into contract on a home to call their own.

Right now, inventory is the big challenge. Here’s what we know today:

According to the latest Existing Home Sales Report from the National Association of Realtors (NAR), there is currently a 3.9-month supply of homes for sale, which can drive this kind of hefty buyer competition. Remember, anything less than 6 months of inventory is a seller’s market.

Even though the month’s supply of inventory is not increasing, ironically, the number of homes for sale is. This means homes are coming up for sale, but they’re being sold quickly. The graph below shows the year-over-year change in inventory over the last 12 months.

Kate_Spad_Blog_Housing-Supply-Year-Over-Year.jpg

As depicted above, the percentage of available inventory has fallen for four consecutive months when compared to the previous year.

So, what does this mean? If you’re a buyer, be sure to get pre-approved for a mortgage and be ready to make a competitive offer, so you can move quickly. Chances are, homes high on your wish list are likely going to go fast.

Bottom Line

If you’re thinking of buying a home, make sure you’re taking the right steps at the beginning of the process, so you’re a top contender if you ultimately find yourself in a bidding war. Reach out to a local real estate professional to determine what you need to do to make your move toward home ownership.

Have You Outgrown Your Home?

It may seem hard to imagine that the home you’re in today – whether it’s your starter home or just one you’ve fallen in love with along the way – might not be your forever home.

The good news is, it’s okay to admit if your house no longer fits your needs.

According to the latest Home Price Insights from CoreLogic, prices have appreciated 3.5% year-over-year. At the same time, the National Association of Realtors (NAR) reports inventory has dropped 4.3% from one year ago.

Kate_Spad_Blog_Prices_and_Inventory.jpg

These two statistics are directly related to one another. As inventory has decreased and demand has increased, prices have been driven up.

This is great news if you own a home and are thinking about selling. The equity in your house has likely risen as prices have increased. Even better is the fact that there’s a large pool of buyers out there searching for the American dream, and your home may be high on their wish list.

Bottom Line

If you think you’ve outgrown your home, reach out to a real estate professional to discuss local market conditions and determine if now is the best time for you to sell.

December 2019 Real Estate News & Updates

Please let me know if you would like to receive my monthly newsletter by messaging me your email address. I promise this will be the only thing I will email you and I will not share your email address.

Thank you,

Kate Spadarotto

December 2019 Real Estate News Updates_Page_1.jpg
December 2019 Real Estate News Updates_Page_2.jpg

The Current 5 Most Popular Real Estate Questions and Answers

  1. Are Mortgage Rates Going to Go Up?

With the price of homes going up due to a strong economy and high demand, mortgage rates are helping to balance it all out by keeping things affordable.

Essentially, the lower your mortgage rate, the lower your monthly payments.

With Freddie Mac predicting that mortgage rates should stay where they are for the next 12 months, this shouldn’t be changing anytime soon.

Kate_Spad_Blog_Mortgage_Rates_Freddie_Mac.jpg

2. Is Now a Good Time to Buy or Sell?

The short answer is: yes and yes.

As said above, low mortgage rates mean it’s a great time for anyone to buy: whether it’s for the first, second or fifth time. This is especially true for someone looking to upgrade their home and purchase one in a higher bracket.

The low mortgage rate will help you afford more house at a lower monthly payment.

Combine that with low inventory and high demand, and you have an equally good seller’s market. This goes especially for homes in the low to mid-range.

Kate_Spad_Blog_Housing_Affordability_Index.jpg

3. Are Home Prices Going to Keep Rising?

Data from the leading experts in real estate and mortgage lending says yes.

But before anyone panics, that means now is the best time to buy and sell.

With mortgage rates expecting to stay where they are and an anticipated 3.5-5% price appreciation happening in the next year, this is without a doubt the best time to buy.

Waiting only means one thing: spending more for the same house.

Take a look at our price appreciation slide so you can show them the facts to back it up.

Kate_Spad_Blog_Projected_Appreciation_Going_Forward.jpg

4. Do I Need to Update My Home Before I Sell It?

Making updates could mean a higher asking price. It could also mean investment loss.

Depending on the type of updates needed, the market’s current low inventory levels put any home that hits the market in a good position to sell. Yes, some homeowners prefer to buy a “turn-key” home. On the flip side, others may want to make the updates themselves, so everything is to their taste.

Check out this post on which updates have the highest return on investment.

5. Is a Recession Going to Cause Home Prices to Fall?

Yes, it’s very likely a recession will hit either next year or the year after. However, this in no way means a housing market catastrophe like the one that occurred in 2008.

Here’s why:

-Of the last five recessions, only two saw a decline in home values with three seeing increases.
-The two that saw declines were in 1991 (-1.9%) and of course, 2008 (-19.7%).
-The current market does not remotely resemble the one before the 2008 crash.
-The top causes for the next recession have nothing to do with the housing market, unlike that of 2008 when risky borrowing led to a bubble that was bound to burst.


Buyers Are Looking For Your Home

Kate_Spad_Blog_Buyers_Are_Looking_For_Your_Home_Now.jpg

Some Highlights:

  • Existing Home Sales are currently at an annual pace of 5.46 million.

  • The inventory of existing homes for sale remains below the 6 months needed for a normal market and is now at a 3.9-month supply.

  • Inventory remains low due to high demand from buyers who are still looking for a house to buy!

Buyer Demand Growing in Every Region

Buyers are out in full force this fall, increasing the demand for homebuying in all four regions of the country.

According to the latest ShowingTime Showing Index,

“Home showing activity was up again nationwide with a 4.6 percent rise in traffic, as the traditionally slow fall season began with a marked boost in buyer interest.”

Buyers clearly have the right idea, as mortgage rates have dropped over a full percentage point since the fall of 2018. They’ve hovered in a historically low range since this summer, making the overall cost of homeownership significantly more attractive and affordable.

Here’s the breakdown of how ShowingTime reports current buyer traffic patterns across the country:

“The West Region, which until August had experienced 18 consecutive months of flagging home buyer traffic, lead the four regions in year-over-year improvement with an 8.9 percent increase in buyer activity.

The South followed with a 6.4 percent increase, the largest such improvement in the region since April 2018, with the Northeast Region’s 5.6 percent increase the next largest among the four regions.

The Midwest’s more modest 0.8 percent year-over-year growth rounded out the nation’s promising month.”

Kate_Spad_Blog_Growth_In_Buyer_Traffic.jpg

With ShowingTime reporting “nationwide growth for the second consecutive month, a first since December 2017 – January 2018”, it’s one more reason why selling your house this winter is the way to go. List while buyers are on the market, before competition with other sellers pops up in your neighborhood.

Bottom Line

If you’re thinking of waiting until spring to sell, think again! Reach out to a local real estate professional to discuss listing your house now while buyer traffic is actively surging throughout the country.

What FICO® Score Do You Need to Qualify for a Mortgage?

With today’s low interest rates, many believe now is a great time to buy – and rightfully so! Fannie Mae recently noted that 58% of Americans surveyed say it is a good time to buy. Similarly, the Q3 2019 HOME Survey by the National Association of Realtors said 63% of people believe now is a good time to buy a home. Unfortunately, fear and misinformation often hold qualified and motivated buyers back from taking the leap into homeownership.

According to the same CNBC article,

“For the first time, the average national credit score has reached 706, according to FICO®, the developer of one of the most commonly used scores by lenders.”

This is great news, as it means Americans are improving their credit scores and building toward a stronger financial future, especially after the market tumbled during the previous decade. With today’s strong economy and increasing wages, many Americans have had the opportunity to improve their credit over the past few years, driving this national average up.

Since Americans with stronger credit are now entering the housing market, we are seeing an increase in the FICO® Score Distribution of Closed Loans (see graph below):

Kate_Spad_Blog_Fico_Score_Distribution.jpg

But hang on – don’t forget that this does not mean you need a FICO® score over 700 to qualify for a mortgage. Here’s what Experian, the global leader in consumer and business credit reporting, says:

FHA Loan: “FHA loans are ideal for those who have less-than-perfect credit and may not be able to qualify for a conventional mortgage loan. The size of your required down payment for an FHA loan depends on the state of your credit score: If your credit score is between 500 and 579, you must put 10% down. If your credit score is 580 or above, you can put as little as 3.5% down (but you can put down more if you want to).”

Conventional Loan: “It’s possible to get approved for a conforming conventional loan with a credit score as low as 620, although some lenders may look for a score of 660 or better.”

USDA Loan“While the USDA doesn’t have a set credit score requirementmost lenders offering USDA-guaranteed mortgages require a score of at least 640.”

VA Loan: “As with income levels, lenders set their own minimum credit requirements for VA loan borrowers. Lenders are likely to check credit scores as part of their screening process, and most will set a minimum score, or cutoff, that loan applicants must exceed to be considered.”

Bottom Line

As you can see, plenty of loans are granted to buyers with a FICO® score that is below the national average. If you’d like to understand the next steps to take when determining your credit score, reach out to a trusted advisor to learn more.

3 Signs the Housing Market Is on the Rebound

The residential real estate market has been plodding along for most of the year. However, three recent reports show the market may be on the verge of a rebound:

1. Existing Home Sales (closed sales) are up, marking two consecutive months of growth.

2. Pending Home Sales (contracts signed) are up with each of the four major regions reporting both month-over-month growth and year-over-year gains in contract activity.
Here is the month-over-month growth:

  • The Northeast rose 0.7%

  • The Midwest increased 0.6%

  • The South increased 1.4%

  • The West grew 3.1%

3. Buyer Traffic (the number of people shopping for a home) is up compared to the same time last year, and for the first time in 13 months.

  • The Northeast is up 5.9%

  • The Midwest increased 1.3%

  • The South is up 2.7%

  • The West grew 2.2%

In their most recent report, ShowingTime Chief Analytics Officer, Daniil Cherkasskiy explained:

“The trend we saw in year-over-year buyer traffic in previous months continued across the United States. For all four regions there were more showings per listing this year compared to last year, making it the most competitive August in the last five years.”

Lawrence Yun, Chief Economist with the National Association of Realtors, believes the uptick in activity will continue into the future:

“It is very encouraging that buyers are responding to exceptionally low interest rates…With interest rates expected to remain low, home sales are forecasted to rise in the coming months and into 2020.”

Bottom Line

If you are thinking about selling your house, there are purchasers out there who are ready, willing, and able to buy.

How Does the Supply of Homes for Sale Impact Buyer Demand?

The price of any item is determined by supply, as well as the market’s demand for the item. The National Association of REALTORS (NAR) surveys “over 50,000 real estate practitioners about their expectations for home sales, prices and market conditions” for their monthly REALTORS Confidence Index.

Their latest edition sheds some light on the relationship between seller traffic (supply) and buyer traffic (demand).

Buyer Demand

The map below was created after asking the question: “How would you rate buyer traffic in your area?”

Kate_Spad_Buyer_Traffic_Sept_30.jpeg

The darker the blue, the stronger the demand for homes is in that area. The survey shows that in 3 of the 50 U.S. states, buyer demand is now very strong; only 2 of the 50 states have a ‘weak’ demand. Overall, buyer demand is slightly lower than this time last year but remains strong.

Seller Supply 

The index also asked: “How would you rate seller traffic in your area?”

Kate_Spad_Seller_Traffic_Sept_30.jpeg

As the map below shows, 18 states reported ‘weak’ seller traffic, 29 states and Washington, D.C. reported ‘stable’ seller traffic, and 3 states reported ‘strong’ seller traffic. This means there are far fewer homes on the market than what is needed to satisfy the buyers who are looking for homes.

Bottom Line

Looking at these maps, it is not hard to see why prices are appreciating in many areas of the country. Until the supply of homes for sale starts to meet buyer demand, prices will continue to increase. If you are debating listing your home for sale, meet with a local real estate professional in your area who can help you capitalize on the demand in the market now.

What Is the Cost of Waiting Until Next Year to Buy?

Kate_Spad_Buy_Now_or_Wait_Sept_27.jpg

Some Highlights:

  • The “cost of waiting to buy” is defined as the additional funds necessary to buy a home if prices and interest rates were to increase over a period of time.

  • Freddie Mac forecasts interest rates will rise to 3.8% by Q4 2020.

  • CoreLogic predicts home prices will appreciate by 5.4% over the next 12 months.

  • If you’re ready and willing to buy your dream home, now is a great time to buy.

One of the Top Reasons to Own a Home

One of the benefits of homeownership is that it is a “forced savings plan.” Here’s how it works: You make a mortgage payment each month. Part of that payment is applied to the principal balance of your mortgage. Each month you owe less on the home. The difference between the value of the home and what you owe is called equity.

If your home has appreciated since the time you purchased it, that increase in value also raises your equity. Over time, the equity in your home could be substantial. Recently, CoreLogic revealed that the average homeowner gained more than $65,000 in equity over the last 5 years.

Unlike last decade, homeowners are no longer foolishly tapping into that equity. In 2006-2008, many owners used their homes like an ATM by pulling equity out to purchase new cars, jet skis, or lavish vacations. They were pulling out cash (equity) from an appreciating asset, and then spending it on rapidly depreciating items. That is not happening anymore.

Over 50% of Homes Have at Least 50% Equity

The number of homeowners that currently have at least 50% equity in their home is astonishing. According to the Urban Institute, 37.1% of all homes in the country are mortgage-free. In a home equity studyATTOM Data Solutions revealed that of the 62.9% of homes with a mortgage, 25.6% have at least 50% equity. That number has been increasing over the last five years:

Kate_Spad_%age_homes_with_equity.jpg

By doing a little math, we can see that 53.2% of all homes in this country have at least 50% equity right now. Of all homes, 37.1% are mortgage-free and an additional 16.1% with a mortgage have at least 50% equity.

Bottom Line

Homeownership is different than renting. When you own, your housing expense (the mortgage payment) comes back to you in the form of equity in your home. That doesn’t happen with your rent payment. Your rent helps build your landlord’s equity instead.

Should You Fix Your House Up or Sell Now?

With the fall season upon us, change is in the air. For many families, children are growing up and moving out of the house, maybe leaving for college or taking a jump into the working world. Parents are finding themselves as empty nesters for the first time. The question inevitably arises: is it finally time to downsize?

If you’re pondering that thought, you may also be wondering if you should fix-up your house before you sell it, or go straight to the market as-is, allowing a potential buyer to do the updates and remodeling. If you’re one of the many homeowners this camp, here are a few tips to help you decide which way to go.

1. Analyze Your Market

A real estate professional can help you to understand your market and the potential level of buyer interest and demand for your home. Are you in a seller’s market or a buyer’s market? This can change based on the price range of your home, too. A professional can also give you some insight on what you can change or remodel, and how to declutter your house to make it attractive to buyers in your area.

2. Get an Inspector

Right now, the average length of time a family stays in a home is between 9-10 years. That’s a little longer than the historical average, so if you’ve been living in your home for a while, it might be time to make some significant improvements. Think: electrical system, HVAC units, roof, siding, etc. An inspector can give you a better idea of the condition of your home, if it is up to current code standards, and recommendations on how to have your house ready before you put it on the market.

3. Decide If You Need to Remodel

You may also be thinking about driving buyer appeal with something like a kitchen or a bathroom remodel. If so, first dig into the market value of your home, and compare it to the actual cost of the remodel. A local real estate professional can help you determine your home’s market value, and you’ll want to get a few quotes from contractors on the potential remodel pricing as well. Once you have those two factors narrowed down, you can to decide if a remodel will give you a return on your investment when you sell. Oftentimes, it is actually more advantageous to price your house to sell, list it competitively, and then let the buyer pick the colors they want for their bathroom tiles and the type of countertop they prefer. The 2019 Cost vs. Value Report in Remodeling Magazine compares the average cost for remodeling projects with the value those projects typically retain at resale.

Bottom Line

Nationwide, inventory is low, meaning there is less than the 6-month housing supply needed for a normal market. This drives buyer demand, creating a perfect time to sell. If you’re considering selling your house, sit down with a local real estate professional. Partner with someone who can help you confidently determine what will be the best choice for you and your family.

Is Your House "Priced to Sell Immediately?"

In today’s real estate market, more houses are coming to market every day. Eager buyers are searching for their dream homes, so setting the right price for your house is one of the most important things you can do.

According to CoreLogic’s latest Home Price Index, home values have risen at over 6% a year over the past two years, but have started to slow to 3.6% over the last 12 months. By this time next year, CoreLogic predicts home values will be 5.4% higher.

With prices slowing from their previous pace, homeowners must realize that pricing their homes a little over market value to leave room for negotiation will actually dramatically decrease the number of buyers who will see their listing (see the chart below).

Kate_Spad_Blog_Pricing_To_Sell.jpg

Instead of the seller trying to ‘win’ the negotiation with one buyer, they should price their house so demand for the home is maximized. By doing so, the seller will not be negotiating with a buyer over the price, but will instead have multiple buyers competing with each other over the house.

The secret is making sure your house is Priced To Sell Immediately (PTSI). That way, your home will be seen by the most potential buyers. It will sell at a great price before more competition comes to the market.

Bottom Line

If you’re debating listing your house for sale, reach out to a local real estate professional to discuss how to price your home appropriately and maximize your exposure.

Homeownership Equity Reaches All-Time-High in Q2

BY: JANN SWANSON

Total home equity, not surprisingly, increased again in the second quarter of the year.  CoreLogic's quarterly Homeowner Equity Insights report, which looks only at properties with one or more mortgages, puts the aggregate increase at $428 billion year-over-year, a 4.8 percent gain.   The company says that 63 percent of residential properties have a mortgage.

"Home values have continued to rise in most parts of the country this year and we are seeing the benefit in higher home equity levels. The western half of the U.S. has experienced particularly strong gains in home equity recently," according to CoreLogic CEO and President Frank Martell. In July 2019, South Dakota and Connecticut were the only two states to post annual home price declines. These losses mirror the states' home equity performances during the second quarter as both reported negative home equity gains per borrower."

The number of mortgage properties that were underwater, owning more on the mortgage or mortgages than the property is worth, totaled 2 million homes or 3.8 percent of all mortgaged properties. This is 151,000 fewer underwater properties (a 9 percent decrease) from the second quarter 2018 total.  At that time the negative equity rate was 4.3 percent.

Frank Nothaft, CoreLogic Chief Economist, said "Borrower equity rose to an all-time high in the first half of 2019 and has more than doubled since the housing recovery started. Combined with low mortgage rates, this rise in home equity supports spending on home improvements and may help improve balance sheets of households who could take out home equity loans to consolidate their debt."

Negative equity at the end of the second quarter of 2019 had an aggregate value of approximately $302.7 billion. This is down quarter over quarter by approximately $2.6 billion, from $305.3 billion in the first quarter of this year.

Negative equity peaked at 26 percent of mortgaged residential properties in the fourth quarter of 2009, based on the CoreLogic equity data analysis which began in the third quarter of 2009.

Kate_Spad_Blog_Sept_21.jpeg

When broken down by household, the aggregate increase in equity averages a gain of $4,900 since the end of Q2 2018. Idaho had the highest year-over-year average increase at $22,100.

Kate_Spad_Blog_Sept_21_2.jpeg


2018's Home Sales Slump Now Fully Erased

BY: JANN SWANSON

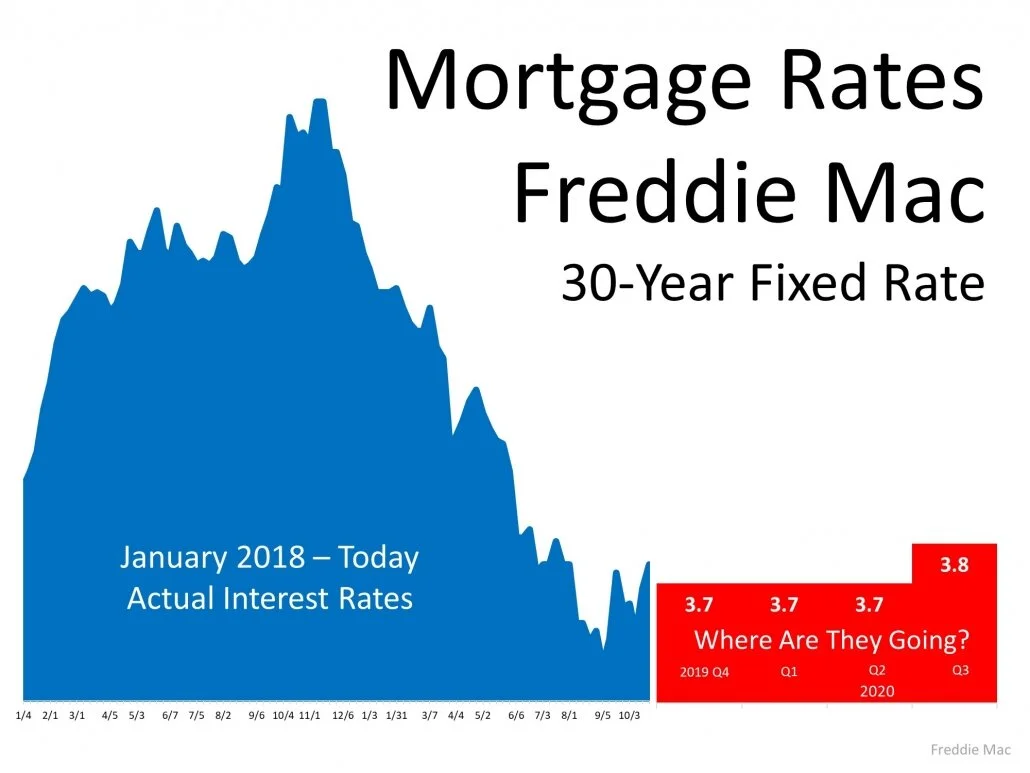
While the increase wasn't as strong as in July, last month's existing home sales posted a second straight month of gains and, as previously, the National Association of Realtors® (NAR) credited falling interest rates.  Sales of previously owned single-family houses, townhouses, condominiums, and cooperative apartments were up 1.3 percent compared to July when sales rose 2.5 percent.  The seasonally adjusted annual rate of 5.49 million units was 2.6 percent higher than the August 2018 pace of 5.35 million. The increase was felt in three of the four major regions while the West continues to demonstrate some weakness.

The month's results were better than predicted.  Analysts polled by Econoday had expected them to come in at an annual rate of 5.30 to 5.42 million with a consensus of 5.38 million.

Single-family home sales rose from 4.84 million in July to 4.90 million in August, a 1.2 percent gain and 2.9 percent above the August 2018 rate. Existing condo sales rose 1.7 percent from July to 590,000 annual units, largely unchanged from the previous August.

Lawrence Yun, NAR's chief economist, said, "As expected, buyers are finding it hard to resist the current rates. The desire to take advantage of these promising conditions is leading more buyers to the market."

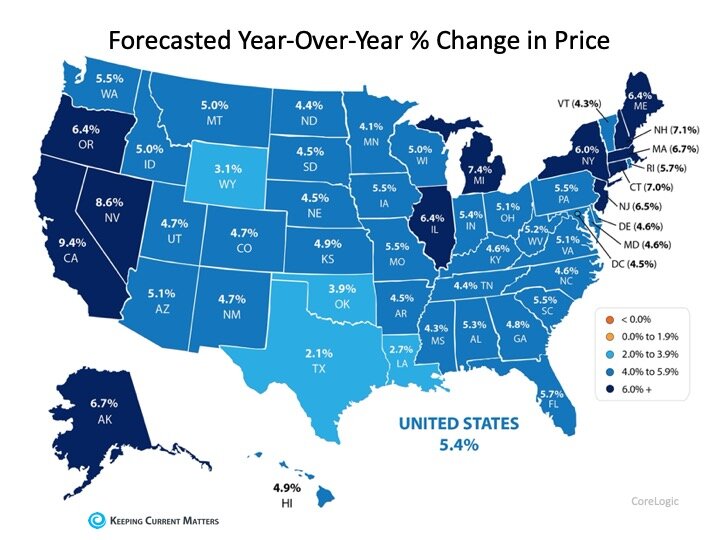
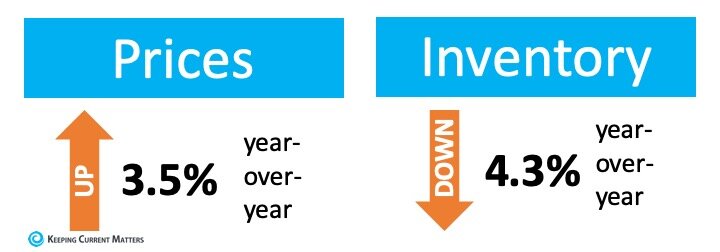
The median existing home price for all housing types in August was $278,200, up 4.7 percent from the median a year earlier of $265,600.  It was the 90th straight month of year-over-year gains. The median existing single-family home price also rose 4.7 percent to $280,700.  Condo prices were up 5.2 percent to a median of $257,600 in August.

"Sales are up, but inventory numbers remain low and are thereby pushing up home prices," said Yun. "Homebuilders need to ramp up new housing, as the failure to increase construction will put home prices in danger of increasing at a faster pace than income."

Inventory fell in August, down from 1.90 million available homes to 1.86 million and 2.6 percent fewer homes than a year earlier. Unsold inventory is at a 4.1-month supply at the current sales pace, down from 4.2 months in July and from the 4.3-month figure recorded in August 2018. Properties typically remained on the market for 31 days in August, up from 29 days in both July and the prior August. Forty-nine percent of homes sold in August were on the market for less than a month.

Yun criticized the quarter point cut in the Fed Funds rate made by the Federal Reserve on Wednesday.  "[The Fed] should have been bolder and made a deeper rate cut, given current low inflation rates," he said. "The housing sector has been broadly underperforming but there is huge upward potential there that will help our overall economy grow."

First-time buyers were responsible for 31 percent of sales in August, the same as a year and investors and second home buyers accounted for 14 percent, up from 11 percent in July.  All-cash sales accounted for 19 percent of transactions in August, about equal to July and moderately below August 2018. Distressed sales remained negligible, representing 2 percent of August sales, a 1-point decline from a year earlier.

 "Rates continue to be historically low, which is extremely beneficial for everyone buying or selling a home," said NAR President John Smaby. "The new [FHA] condominium loan policies, as well as other reforms NAR is pursuing within our housing finance system, will allow even more families and individuals in this country to reach the American Dream of homeownership."

There were month-over-month increases in existing home sales in the Northeast, Midwest, and South and sales in all four regions bested their 2018 numbers. Sales in the Northeast increased 7.6 percent from July to an annual rate of 710,000 units, 1.4 percent higher than in August 2018. The median price fell 0.3 percent on an annual basis to $303,500.

Existing-home sales grew 3.1 percent in the Midwest to an annual rate of 1.31 million, topping sales from a year earlier by 2.3 percent.  The median price jumped 6.6 percent to $220,000.

In the South there was a gain of 0.9 percent in sales to a rate of 2.33 million and sales were 3.6 percent higher year-over-year. The median price of $240,300 was a 5.4 percent annual increase.

While sales remained 1.8 percent higher on an annual basis, the West was an outlier in August. Existing home sales declined 3.4 percent to 1.14 million. Prices, however, continued their strong appreciation, rising 5.7 percent to $415,900.

The Fed and Mortgage Rates

One of the greatest potential sources of confusion for prospective mortgage borrowers is the relationship between the Fed and mortgage rates.  While the Fed's policy changes absolutely have a big impact on all sorts of interest rates (including mortgages), a drop in the Fed's policy rate DOES NOT result in lower mortgage rates. 

The main reason for confusion is the fact that there's a huge difference from an investment standpoint between a rate that governs the shortest-term transactions (The Fed Funds Rate applies to loans that last for 1 day or less) and a rate that can remain in effect for up to 30 years in the case of mortgages.  Even if we use the average life span of a 30yr fixed mortgage, we're still talking about 5-10 years depending on the broader market landscape. You may have heard about the "inverted yield curve?"  That's a reference to vastly different behavior between longer and shorter term rates, and it stands as evidence of the different sets of concerns that apply to each side of the duration spectrum.  The differences are only more pronounced when we take the shorter end of the spectrum all the way down to the "overnight" level (Fed Funds Rate) and all the way up to the duration of the average mortgage loan.

Beyond the fact that a mortgage rate is very simply a different animal than the Fed Funds Rate, there's also the matter of frequency of movement.  The Fed only meets to potentially change rates 8 times a year.  Mortgage rates change every day--sometimes more than once.  And the bond markets that underlie mortgage rates change thousands of times per day.  That means the mortgage market can easily and quickly get into position for any expected move from the Fed.  In today's case, where the rate cut was seen as highly likely, any effect that the Fed Funds Rate could ever have on mortgage rates was already priced-in weeks ago.

But let's say the first two points don't quite convince you.  The third is irrefutable.  The Fed doesn't just take the stage, cut rates, and go home.  They release a ton of other info and hold a press conference to discuss their present and future policy decisions.  The rates market (for mortgages, Treasuries, and everything else) is tremendously interested in all that "other stuff."  Today, particularly, there was a set of updated forecasts for future rate movements.  These were a bit less market-friendly than the average investor expected.  In addition, market participants interpreted Powell's press conference as being a bit less friendly than expected.

Long story short: there are multiple reasons for mortgage rates to go their own way regardless of the Fed rate cut. 

BY: MATTHEW GRAHAM

6 Graphs Showing the Strength of the Current Housing Market

Kate_Spadarotto_Blog_Sept_13_2019.jpg

Some Highlights:

  • Keeping an eye on the current status of the housing market is one of the best ways to make powerful and confident decisions when buying or selling a home.

  • Mortgage rates remaining near historic lows and houses selling in an average of only 29 days are just two key elements driving the strength of today’s market.

  • With the national data shown here, make sure to also determine what’s happening in your local market so you are fully informed when you’re ready to make your next move.

What is the Probability That Homes Values Sink?

With the current uncertainty about the economy triggered by a potential trade war, some people are waiting to purchase their first home or move-up to their dream house because they think or hope home prices will drop over the next few years. However, the experts disagree with this perspective.

Here is a table showing the predicted levels of appreciation from six major housing sources:

Kate_Spadarotto_Projected_Home_Price_Appreciation.jpg

As we can see, every source believes home prices will continue to appreciate (albeit at lower levels than we have seen over the last several years). But, not one source is calling for residential real estate values to depreciate.

Additionally, ARCH Mortgage Insurance Company in their current Housing and Mortgage Market Review revealed their latest ARCH Risk Index, which estimates the probability of home prices being lower in two years. There was not one state that even had a moderate probability of home prices lowering. In fact, 34 of the 50 states had a minimal probability.

Kate_Spadarotto_Probability_Home_Prices_Being_Lower.jpg

Bottom Line

Those waiting for prices to fall before purchasing a home should realize that the probability of that happening anytime soon is very low. With mortgage rates already at near historic lows, now may be the time to act.