Pricing

Why the Stock Market Correction Probably Won't Impact Home Values

With the housing crash of 2006-2008 still visible in the rear-view mirror, many are concerned the current correction in the stock market is a sign that home values are also about to tumble. What’s taking place today, however, is nothing like what happened the last time. The S&P 500 did fall by over fifty percent from October 2007 to March 2009, and home values did depreciate in 2007, 2008, and 2009 – but that was because that economic slowdown was mainly caused by a collapsing real estate market and a meltdown in the mortgage market.

This time, the stock market correction is being caused by an outside event (the coronavirus) with no connection to the housing industry. Many experts are saying the current situation is much more reminiscent of the challenges we had when the dot.com crash was immediately followed by 9/11. As an example, David Rosenberg, Chief Economist with Gluskin Sheff + Associates Inc., recently explained:

“What 9/11 has in common with what is happening today is that this shock has also generated fear, angst and anxiety among the general public. People avoided crowds then as they believed another terrorist attack was coming and are acting the same today to avoid getting sick. The same parts of the economy are under pressure ─ airlines, leisure, hospitality, restaurants, entertainment ─ consumer discretionary services in general.”

Since the current situation resembles the stock market correction in the early 2000s, let’s review what happened to home values during that time.

Kate_Spad_Blog_Dot.com_and_9-11_Crash.jpg

The S&P dropped 45% between September 2000 and October 2002. Home prices, on the other hand, appreciated nicely at the same time. That stock market correction proved not to have any negative impact on home values.

Bottom Line

If the current situation is more like the markets in the early 2000s versus the markets during the Great Recession, home values should be minimally affected, if at all.

Source


5 Simple Graphs Proving This is NOT Like Last Time

With all of the volatility in the stock market and uncertainty about the Coronavirus (COVID-19), some are concerned we may be headed for another housing crash like the one we experienced from 2006-2008. The feeling is understandable. Ali Wolf, Director of Economic Research at the real estate consulting firm Meyers Research, addressed this point in a recent interview:

“With people having PTSD from the last time, they’re still afraid of buying at the wrong time.”

There are many reasons, however, indicating this real estate market is nothing like 2008. Here are five visuals to show the dramatic differences.

1. Mortgage standards are nothing like they were back then.

During the housing bubble, it was difficult NOT to get a mortgage. Today, it is tough to qualify. The Mortgage Bankers’ Association releases a Mortgage Credit Availability Index which is “a summary measure which indicates the availability of mortgage credit at a point in time.” The higher the index, the easier it is to get a mortgage. As shown below, during the housing bubble, the index skyrocketed. Currently, the index shows how getting a mortgage is even more difficult than it was before the bubble.

Kate_Spad_Blog_Historic_Data_for_the_Mortgage_Credit_Availability_Index.jpg

2. Prices are not soaring out of control.

Below is a graph showing annual house appreciation over the past six years, compared to the six years leading up to the height of the housing bubble. Though price appreciation has been quite strong recently, it is nowhere near the rise in prices that preceded the crash.

Kate_Spad_Blog_Annual_Home_Price_Appreciation.jpg

There’s a stark difference between these two periods of time. Normal appreciation is 3.6%, so while current appreciation is higher than the historic norm, it’s certainly not accelerating beyond control as it did in the early 2000s.

3. We don’t have a surplus of homes on the market. We have a shortage.

The months’ supply of inventory needed to sustain a normal real estate market is approximately six months. Anything more than that is an overabundance and will causes prices to depreciate. Anything less than that is a shortage and will lead to continued appreciation. As the next graph shows, there were too many homes for sale in 2007, and that caused prices to tumble. Today, there’s a shortage of inventory which is causing an acceleration in home values.

Kate_Spad_Blog_Monthly_Inventory_of_Hpmes_for_Sale.jpg

4. Houses became too expensive to buy.

The affordability formula has three components: the price of the home, the wages earned by the purchaser, and the mortgage rate available at the time. Fourteen years ago, prices were high, wages were low, and mortgage rates were over 6%. Today, prices are still high. Wages, however, have increased and the mortgage rate is about 3.5%. That means the average family pays less of their monthly income toward their mortgage payment than they did back then. Here’s a graph showing that difference:

Kate_Spad_Blog_Percent_of_Median_Income_Needed_to_Purchase_a_Median_Priced_Home.jpg

5. People are equity rich, not tapped out.

In the run-up to the housing bubble, homeowners were using their homes as a personal ATM machine. Many immediately withdrew their equity once it built up, and they learned their lesson in the process. Prices have risen nicely over the last few years, leading to over fifty percent of homes in the country having greater than 50% equity. But owners have not been tapping into it like the last time. Here is a table comparing the equity withdrawal over the last three years compared to 2005, 2006, and 2007. Homeowners have cashed out over $500 billion dollars less than before:

Kate_Spad_Blog_Total_Home_Equity_Cashed_Out.jpg

During the crash, home values began to fall, and sellers found themselves in a negative equity situation (where the amount of the mortgage they owned was greater than the value of their home). Some decided to walk away from their homes, and that led to a rash of distressed property listings (foreclosures and short sales), which sold at huge discounts, thus lowering the value of other homes in the area. That can’t happen today.

Bottom Line

If you’re concerned we’re making the same mistakes that led to the housing crash, take a look at the charts and graphs above to help alleviate your fears.

Equity Gain Growing in Nearly Every State

Rising home prices have been in the news a lot lately, and much of the focus is on whether they’re accelerating too quickly and how sustainable the growth in prices really is. One of the often-overlooked benefits of rising prices, however, is the impact they have on a homeowner’s equity position.

Home equity is defined as the difference between a home’s fair market value and the outstanding balance of all liens on the property. While homeowners pay down their mortgages, the amount of equity they have in their homes climbs each time the value increases.

Today, the number of homeowners that currently have significant equity in their homes is growing. According to the Census Bureau, 38% of all homes in the country are mortgage-free.  In a home equity studyATTOM Data Solutions revealed that of the 54.5 million homes with a mortgage, 26.7% of them have at least 50% equity. That number has been increasing over the last eight years.

CoreLogic also notes:

“…the average homeowner gained approximately $5,300 in equity during the past year.”

The map below shows a breakdown of the increasing equity gain across the country, painting a clear picture that home equity is growing in nearly every state.

Kate_Spad_Blog_Average_Equity_Gain.jpg

Bottom Line

This may be the year to take advantage of your home equity by applying it forward, either as you downsize or as you move up to a new home.

How Much "Housing Wealth" Can You Build in a Decade?

Earlier this month, the National Association of Realtors (NAR) released a special study titled Single-Family Home Price Gains by Years of Tenure. The study estimates median home price appreciation over the last 30 years based on the length of homeownership.

Below are three graphs depicting the most important data revealed in the study.

How much have home prices increased?

One of the first measures of the financial benefits of homeownership is the net worth (in the form of equity) an owner can build over time. The study showed the average increase in home values based on how long homeowners stayed in a home.

Kate_Spad_Blog_The_Longer_You_Own_A_Home_The_More_Equity_You_Gain.jpg

What was the percentage of appreciation?

Another way to look at this is by the percentage increase in value over time, called appreciation:

Kate_Spad_Blog_Appreciation_Grows_The_Longer_You_Own_A_Home.jpg

Was this appreciation consistent throughout the country?

Today, when we think of markets that have done well over the last decade, we have a tendency to think about San Francisco, San Diego, Seattle, and other West Coast cities. Though it is true the West Region showed the highest price growth over the last three decades, we can see how every region of the country did quite well in ten-year increments:

Kate_Spad_Blog_10_Year_Home_Appreciation.jpg

This data validates the claim that homeownership is great for building wealth. The importance of this information was highlighted in the study’s first sentence:

“Homeownership is an important source of wealth creation, enabling current homeowners and succeeding generations to move up the economic ladder.”

Bottom Line

Homeownership has many financial and non-financial benefits. The accumulation of “housing wealth” through increased equity is a major one. If you’re thinking of buying a home for the first time or moving up to your dream home, the sooner you make the move, the sooner your net worth will begin to grow.

The #1 Misconception in the Homebuying Process

After over a year of moderating home prices, it appears home value appreciation is about to reaccelerate. Skylar Olsen, Director of Economic Research at Zillow, explained in a recent article:

 “A year ago, a combination of a government shutdown, stock market slump and mortgage rate spike caused a long-anticipated inventory rise. That supposed boom turned out to be a short-lived mirage as buyers came back into the market and more than erased the inventory gains. As a natural reaction, the recent slowdown in home values looks like it’s set to reverse back.”

CoreLogic, in their January 2020 Market Pulse Report, agrees with Olsen, projecting home value appreciation in all fifty states this year. Here’s the breakdown:

  • 21 states appreciating 5% or more

  • 26 states appreciating between 3-5%

  • Only 3 states appreciating less than 3%

The Misconception

Many believe when real estate values are increasing, owning a home becomes less affordable. That misconception is not necessarily true.

In most cases, homes are purchased with a mortgage. The current mortgage rate is a major component of the affordability equation. Mortgage rates have fallen by almost a full percentage point since this time last year.

Another major piece of the equation is a buyer’s income. The median family income has risen by 5% over the last year, contributing to the affordability factor.

Black Knight, in their latest Mortgage Monitor, addressed this exact issue:

 “Despite the average home price increasing by nearly $13,000 from just over a year ago, the monthly mortgage payment required to buy that same home has actually dropped by 10% over that same span due to falling interest rates…

Put another way, prospective homebuyers can now purchase a $48K more expensive home than a year ago while still paying the same in principal and interest, a 16% increase in buying power.”

Bottom Line

If you’re thinking about purchasing a home, realize that homes are still affordable even though prices are increasing. As the Black Knight report concluded:

“Even with home price growth accelerating, today’s low-interest-rate environment has made home affordability the best it’s been since early 2018.”

The 4 Crucial Real Estate Questions

This is going to be an exciting year for real estate. The upcoming presidential election, a possible recession, and political tensions are all factors leading to confusion and hesitancy.

Will the Presidential Election Impact Real Estate?

Election years can be a tricky time for the market. During this time, both sides of the spectrum will be preaching conflicting statements about the economy – leading to confusion among potential buyers and sellers.

That’s why many people tend to sit back and wait until the election is over before making any major real estate decisions. This isn’t a new phenomenon, but with the market’s current strength and mortgage rates at historic lows, putting off buying or selling could mean less of a reward as more time goes on.

Is a Recession Around the Corner?

When a media storm of recession talk hit the news in 2019, many people affiliated it with another housing market collapse. The fears aren’t surprising, but they’re also not accurate.

Economists are now reporting that if a recession occurs, it may not be until 2021 or even 2022. On top of that, the real estate market is not a likely driving factor for an economic downturn, and the four recessions before 2008 saw little to no effect on the housing market.

What If I Buy a Home and Prices Depreciate?

It’s the greatest fear a new homeowner has. Many prospective buyers may be holding off on their search because of uncertainty tied to the upcoming presidential election and recession rumors.

The market is strong and big hitters like Freddie Mac, Fannie Mae and NAR predict home values to continue to appreciate through 2021.

Buying now is a sound investment, and buyers should take advantage of the current low mortgage rates because waiting to purchase a home could mean paying more.

Kate_Spad_Blog_Home_Prices_Projected_To_Continue_To_Appreciate.png

Should I Take Advantage of Interest Rates Now or Wait?

Essentially this comes down to one thing: why take the chance?

Interest rates are currently at historic lows, and you are probably unaware of their increased buying power. Although the mortgage rates are projected to hold steady around 3.8%, certain factors could change this.

If you hold off on your home search and mortgage rates do rise, you will end up paying more for the same house.

There are major benefits to buying your dream home this year.


Mortgage Rates Digging Deeper Into Multi-Year Lows

BY: MATTHEW GRAHAM

Feb 3 2020, 5:39PM

In the world of interest rates, it's good to be a mortgage today.  The dominant species on that world is US Treasuries: the quintessential dollar-based loans (after all, they are loans to the US government).  Loaning dollars to the entity responsible for the dollar is about as foundational as it gets, but I digress.

Treasuries and mortgage rates tend to move in the same direction and by generally similar amounts. That's because mortgage rates are based on underlying bonds (mortgage-backed securities or "MBS") that are fairly similar to Treasuries in most of the ways investors care about.  The prices of MBS dictate where lenders can and should set their interest rates, but ultimately, it's up to the lender.  If they're flush with business and want to slow things down, they might set rates a bit higher.  The same thing can happen heading into a weekend during times of elevated volatility.

Such was the case on Friday.  Lenders had a nice improvement in MBS to work with.  It allowed them to lower rates a bit more than they actually did.  Now, as the new week begins, Treasury yields and MBS alike are indicating slightly higher rates than Friday, but because lenders played it so safe, they were instead able to offer slightly LOWER rates today.  Simply put, mortgage rates are even deeper into multi-year lows now, even though the bond market is pointing to slightly higher rates versus last Friday. 


Loan Originator Perspective

Bond yields hit a bit of a wall Monday, moving upward from Friday's multi-year lows, amid upbeat economic data and potential progress on a Wuhan virus treatment.  We may not be at the very lowest yields here, but it'd take monumentally horrible news to move rates much lower.  I am locking loans closing within 45 days for all but the most risk craving clients.  - Ted Rood, Senior Originator


Today's Most Prevalent Rates For Top Tier Scenarios 

  • 30YR FIXED - 3.375-3.5%

  • FHA/VA - 3.125 - 3.25%

  • 15 YEAR FIXED - 3.125-3.25% 

  • 5 YEAR ARMS -  3.25-3.75% depending on the lender


Ongoing Lock/Float Considerations 

  • 2019 was the best year for mortgage rates since 2011.  Big, long-lasting improvements such as this one are increasingly susceptible to bounces/corrections 

  • Fed policy and the US/China trade war have been key players (and more recently, the coronavirus outbreak).  Major updates on either front could cause a volatile reaction in rates.  

  • The Fed and the bond market (which dictates rates) will be watching economic data closely, both at home and abroad, as well as updates on other factors like trade and viral epidemics. The stronger the data the more rates could rise, while weaker data will lead to new long-term lows.  

  • Rates discussed refer to the most frequently-quoted, conforming, conventional 30yr fixed rate for top tier borrowers among average to well-priced lenders.  The rates generally assume little-to-no origination or discount except as noted when applicable.  Rates appearing on this page are "effective rates" that take day-to-day changes in upfront costs into consideration.

Where Homebuyers Are Heading By Generation

Kate_Spad_Blog_Where_Home_Buyers_Are_Headed_By_Generation.jpg

Some Highlights:

  • Whether capitalizing on job opportunities, affordability, or warm-weather places to retire, Americans are making moves to these top cities to take advantage of the strength in the current housing market.

  • A strong economy and lower mortgage rates have made it easier for many would-be buyers to get into the market. According to realtor.com, it just depends on which market.

  • To find the top market in your area, contact a local real estate professional.

Homes Are More Affordable Today, Not Less Affordable

There’s a current narrative that owning a home today is less affordable than it has been in the past. The reason some are making this claim is because house prices have substantially increased over the last several years.

It’s not, however, just the price of a home that matters.

Homes, in most cases, are purchased with a mortgage. The current mortgage rate is a major component of the affordability equation. Mortgage rates have fallen by over a full percentage point since December 2018. Another major piece of the affordability equation is a buyer’s income. The median family income has risen by approximately 3% over the last year.

The National Association of Realtors (NAR) releases a monthly Housing Affordability Index. The latest index shows that home affordability is better today than at almost any point over the last 30 years. The index determines how affordable homes are based on the following:

“A Home Affordability Index value of 100 means that a family with the median income has exactly enough income to qualify for a mortgage on a median-priced home. An index of 120 signifies that a family earning the median income has 20 percent more than the level of income needed pay the mortgage on a median-priced home, assuming a 20 percent down payment so that the monthly payment and interest will not exceed 25 percent of this level of income (qualifying income).”

The higher the index, therefore, the more affordable homes are. Here is a graph showing the index since 1990:

Kate_Spad_Blog_Housing_Affordability_Index_1990_to_Today.jpg

Obviously, affordability was better during the housing crash when distressed properties – foreclosures and short sales – sold at major discounts (2009-2015). Outside of that period, however, homes are more affordable today than any other year since 1990, except for 2016.

The report on the index also includes a section that calculates the mortgage payment on a median priced home as a percentage of the median national income. Historically, that percentage is just above 21%. Here are the percentages since June of 2018:

Kate_Spad_Blog_Payment_As_A_%_Of_Income.jpg

Again, we can see that affordability is much better today than the historical average and has been getting better over the last year and a half.

Bottom Line

Whether you’re thinking about buying your first home or moving up to the home of your dreams, don’t let the false narrative about affordability prevent you from moving forward. From an affordability standpoint, this is one of the best times to buy in the last 30 years.

The 2020 Real Estate Projections That May Surprise You

This will be an interesting year for residential real estate. With a presidential election taking place this fall and talk of a possible recession occurring before the end of the year, predicting what will happen in the 2020 U.S. housing market can be challenging. As a result, taking a look at the combined projections from the most trusted entities in the industry when it comes to mortgage rateshome sales, and home prices is incredibly valuable – and they may surprise you.

Mortgage Rates

Projections from the experts at the National Association of Realtors (NAR), the Mortgage Bankers Association (MBA), Fannie Mae, and Freddie Mac all forecast mortgage rates remaining stable throughout 2020:

Kate_Spad_Blog_30_Yr_Mortgage_Rate_Projected_To_Remain_Stable.jpg

Since rates have remained under 5% for the last decade, we may not fully realize the opportunity we have right now.

Here are the average mortgage interest rates over the last several decades:

  • 1970s: 8.86%

  • 1980s: 12.70%

  • 1990s: 8.12%

  • 2000s: 6.29%

Home Sales

Three of the four expert groups noted above also predict an increase in home sales in 2020, and the fourth sees the transaction number remaining stable:

Kate_Spad_Blog_Home_Sales_Projected_To_Grow_2020.jpg

With mortgage rates remaining near all-time lows, demand should not be a challenge. The lack of available inventory, however, may moderate the increase in sales.

Home Prices

Below are the projections from six different expert entities that look closely at home values: CoreLogicFannie Mae, Ivy Zelman’s “Z Report”, the National Association of Realtors (NAR), Freddie Mac, and the Mortgage Bankers Association (MBA).Each group has home values continuing to improve through 2020, with four of them seeing price appreciation increasing at a greater pace than it did in 2019.

Kate_Spad_Blog_Home_Values_Expected_to_Continue_Appreciating.jpg

Is a Recession Possible?


In early 2019, a large percentage of economists began predicting a recession may occur in 2020. In addition, a recent survey of potential home purchasers showed that over 50% agreed it would occur this year. The economy, however, remained strong in the fourth quarter, and that has caused many to rethink the possibility.

For example, Goldman Sachs, in their 2020 U.S. Outlook, explained:

“Markets sounded the recession alarm this year, and the average forecaster now sees a 33% chance of recession over the next year. In contrast, our new recession model suggests just a 20% probability. Despite the record age of the expansion, the usual late-cycle problems—inflationary overheating and financial imbalances—do not look threatening.”

Bottom Line

Mortgage rates are projected to remain under 4%, causing sales to increase in 2020. With growing demand and a limited supply of inventory, prices will continue to appreciate, while the threat of an impending recession seems to be softening. It looks like 2020 may be a solid year for the real estate market.

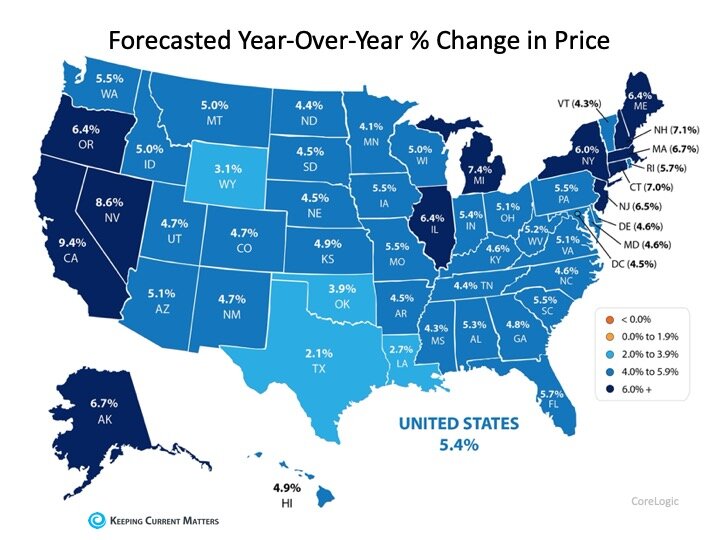
2020 Forecast Shows Continued Home Price Appreciation

Questions continue to rise around where home prices will head in 2020. The latest forecast from CoreLogic shows continued appreciation at 5.4% over the next year:

Kate_Spad_Blog_Forecasted_Year_Over_Year_Change_In_Price.jpg

Additionally, ARCH Mortgage Insurance Company in their current Housing and Mortgage Market Review revealed their latest ARCH Risk Index, which estimates the probability of home prices being lower in two years. Based on the most recent results, 32 of the 50 U.S. states (plus D.C.) had a minimal probability of lowering by 2021.

Kate_Spadarotto_Probability_Home_Prices_Being_Lower.jpg

Bottom Line

Experts forecast home price appreciation to continue at a moderate rate as we move through 2020 and beyond. With appreciation growing, now is a great time to reach out to a real estate professional and plan for your next move.

December 2019 Real Estate News & Updates

Please let me know if you would like to receive my monthly newsletter by messaging me your email address. I promise this will be the only thing I will email you and I will not share your email address.

Thank you,

Kate Spadarotto

December 2019 Real Estate News Updates_Page_1.jpg
December 2019 Real Estate News Updates_Page_2.jpg

Have You Budgeted for Closing Costs?

Saving for a down payment is a key step in the homebuying process, and it’s not the only piece you need to include in your budget. Another factor that’s important to plan for is the closing costs required to obtain a mortgage.

What Are Closing Costs?

According to Trulia,

When you close on a home, a number of fees are due. They typically range from 2% to 5% of the total cost of the home, and can include title insurance, origination fees, underwriting fees, document preparation fees, and more.”

For those who buy a $250,000 home, for example, that amount could be between $5,000 and $12,500 in closing fees. Keep in mind, if you’re in the market for a home above this price range, your costs could be significantly greater. As mentioned before,

Closing costs are typically between 2% and 5% of your purchase price.

 Trulia gives more great advice, saying,

“There will be lots of paperwork in front of you on closing day, and not enough time to read them all. Work closely with your real estate agent, lender, and attorney, if you have one, to get all the documents you need ahead of time.

The most important thing to read is the closing disclosure, which shows your loan terms, final closing costs, and any outstanding fees. You’ll get this form about three days before closing since, once you (the borrower) sign it, there’s a three-day waiting period before you can sign the mortgage loan docs. If you have any questions about the numbers or what any of the mortgage terms mean, this is the time to ask—your real estate agent is a great resource for getting you all the answers you need.”

Bottom Line

Reach out to your lender and a local real estate professional to discuss the homebuying process, to be sure your plan includes budgeting for what you need to purchase your dream home – without any surprises!